Navigating the Future of Equity Returns: Historical Insights and Strategic Outlook
We have been counseling clients to expect long-term equity returns to be below historical averages for the foreseeable future. For us, long-term usually means at least a 5-year period. With that in mind, I thought it would be useful to provide some context. What are “normal” returns, and why does the current market environment cause us to provide such a cautious outlook?
To establish a baseline of normal returns, I think it is useful to look at history. A starting point of 1957 seems a bit arbitrary, but it is useful to focus our attention on the modern market experience. If we are to look back nearly 67 years (1957-2024), we find the long-term nominal market (S&P 500 Index) return is 10.7% I say nominal because it is important when comparing various time periods to understand the inflation environment of the period being studied. The inflation rate over that same period was 3.7%, so the real return was approximately 7.0%. This seems a reasonable baseline in comparing the real return normally available to equity investors.
I focus on this longer period, but investors’ more recent experience is noticeably different, and therefore, their view of what constitutes “normal” returns may vary from the 67-year period presented. For example, if we look at the beginning of this secular bull market, our starting period would be August 1982. Long-term equity returns from that date until today are around 12.8% in an era of 2.9% inflation. A 9.9% real return over a 42-year period seems incredibly high. The returns can be even more extreme when looking at the 15-plus year period beginning at the market low of March 2009. The market returned 16.3% in a 2.4% inflation environment. Real returns of 13.9% over a 15-year period are incredible and, in my opinion, unsustainable.
I provide this perspective to add context to the discussion of prospective returns. I am concerned the perspective of many current equity investors has been shaped by our most recent experience without realizing how fortunate we have been. These are not normal return levels, but many investors who may have begun investing in the last decade may not realize it is unrealistic to expect these returns to continue.
One way of looking at the opportunity in equities is to examine the equity risk premium. The equity risk premium is the amount of excess return equities could be expected to generate relative to another asset given the additional risk investors accept to purchase the more volatile asset. My preferred comparable asset is the 10-year Treasury. So, the historical equity risk premium from 1957-2024 between the S&P 500 and the 10-year Treasury is approximately 485 basis points (bps). So, with the current 10-year yield at 4.6% (as of the end of 2024), nominal equity returns north of 9% seems reasonable.
That level of return would make sense if the market is priced in line with the 10-year Treasury at 4.6%. But the market is currently priced very aggressively. To give some perspective, when we studied this issue in Spring 2014, we concluded that equities should be priced at approximately 19X earnings with Treasuries yielding 2.7%. With the currently higher interest rates it would only make sense that multiples should contract from that 19X level. This compression of earnings multiples should have the effect of lowering the long-term return. So 9%+ returns might, in fact, be a generous estimate.
One way to project future equity returns is to break down the components of those returns. Long-term returns can be derived from three sources: earnings growth, multiple expansion and dividend return. The data in Exhibit 1 is provided courtesy of the Leuthold Group.
Exhibit 1 — Contributions to S&P 500 Total Return
| 4 March 1957 through 11 November 2024 |
|
4 March 1957 |
11 November 2024 |
Cumulative % Change |
1957-2024 Annualized (%) |
| S&P 500 12M Trailing GAAP EPS |
$3.46 |
$195.93 |
5,563 |
6.2 |
| P/E on 12M Trailing GAAP EPS |
12.7x |
30.6x |
141 |
1.3 |
| S&P 500 |
44.06 |
6,001.35 |
13,521 |
7.5 |
| Dividends Per Share |
$1.74 |
$75.54 |
4,241 |
5.7 |
| Dividend Yield |
3.95% |
1.26% |
— |
— |
| Dividend Contribution to Return |
— |
— |
— |
3.2 |
| S&P 500 Total Return Index |
13.38 |
13,146.20 |
98,153 |
10.7 |
| 12 August 1982 Secular Low through 11 November 2024 |
|
12 August 1982 |
11 November 2024 |
Cumulative % Change |
1957-2024 Annualized (%) |
| S&P 500 12M Trailing GAAP EPS |
$14.81 |
$195.93 |
1,223 |
6.3 |
| P/E on 12M Trailing GAAP EPS |
6.9x |
30.6x |
343 |
3.6 |
| S&P 500 |
102.42 |
6,001.35 |
5,760 |
10.1 |
| Dividends Per Share |
$6.81 |
$75.54 |
1,009 |
5.9 |
| Dividend Yield |
6.65% |
1.26% |
— |
— |
| Dividend Contribution to Return |
— |
— |
— |
2.7 |
| S&P 500 Total Return Index |
82.09 |
13,146.20 |
15,914 |
12.8 |
Source: The Leuthold Group. Used with permission.
It is enlightening to look at the period of the bull market beginning in 1982. One indicator of future earnings growth for the market is past experience. Beginning in August 1982, S&P 500 earnings growth compounded at 6.3% annually (see Exhibit 1). I think this is the best indicator of future earnings growth as there has been no meaningful change in the source of corporate profits. Another source of future returns is dividends. Since August 1982, dividend yield has contributed 2.7% to the long-term return on equities. But, of course, one fact we know is the current dividend yield is meaningfully lower than that experienced in the preceding decades. The current dividend yield on the market is 1.3% as of 31 December 2024. So, if we combine earnings growth with dividend yield, we get an approximate return of 7.6%. This is a fairly reasonable estimate of future returns in a 4.5% 10-year Treasury environment.
But that assumes no change in the market’s valuation of its earnings expressed as the P/E multiple. As we noted earlier, the market is currently priced very aggressively, considering long-term interest rates are 4.5%. If 19X earnings was the appropriate multiple in 2014 with interest rates at 2.70%, then certainly a multiple comfortably below 19X would seem more appropriate. Looking at market history, a multiple of 17X in this environment might be more appropriate. But what does this mean for prospective returns investors should be able to achieve in this market environment?
Exhibit 2 — 10Y Estimated Returns
| 2025 S&P 500
consensus EPS |
2035E EPS |
CAGR |
S&P 500 price level |
S&P 500 price level
in 2035 at 17X(e) |
CAGR |
Annualized price return |
Annual dividend yield |
Total return |
| 272.94 |
502.80 |
6.3% |
5881.63 |
8547.60 |
3.8% |
3.8% |
1.3% |
5.1% |
Source: Factset, as of 31 December 2024.
As noted previously, using consensus earnings estimates for 2025 and growing those earnings at a normal 6.3% annual rate provides 2035 earnings of $502.80 for the S&P 500 (Exhibit 3). Using the 17X multiple of those earnings we discussed earlier leads to a target S&P 500 Index level of approximately 8,548 by year-end 2035. That represents a 3.8% compound annual growth rate. Add the dividend yield to that calculation and you get an estimated total return for the next decade for the S&P 500 Index of just over 5%. As you can see from the calculation, long-term returns are hindered by the low dividend yield as well as the projected contraction of the earnings multiple. This is the price we pay for today’s high valuations. To achieve returns in excess of these levels would require sustained above-normal earnings growth. That seems unlikely since the preceding decades have benefitted from declining interest costs and a lower corporate tax rate. A higher earnings multiple would also help, but, in my opinion, that would require meaningfully lower interest rates. That also does not seem likely.
It is important to understand the central issue driving the below-normal returns is the contraction in the price/earnings multiple. After 40 years of ever-rising P/E multiples, it appears we could enter a period of secular multiple contraction. This contraction would be driven by the end of the 40-year bull market in bonds which had begun in October 1981. This is an important market issue that has received surprisingly little discussion. Ten-year Treasury yields in this period have contracted from 15.3% in late 1981 to a low of 0.6% in 2020. These ever-lower interest rates have driven an expansion of price earnings multiples. Unfortunately, the bond selloff in the last four years clearly indicates this secular bond bull market is over (Exhibit 3).
Exhibit 3 — US 10Y Treasury Yield 1981-2024 (%)

Source: FRED, Federal Reserve Bank of St. Louis; https://fred.stlouisfed.org/series/DGS10.
In many ways, I view the P/E multiple as a shorthand expression of the discount rate of future cash flows. That discount rate is driven by the level of long-term interest rates available in the market. This rise in rates over the last four years should trigger a commensurate decline in valuation multiples. As of now, that contraction in valuation has not occurred. However, when given a long-term time horizon, this valuation contraction can be expected to meaningfully limit the returns available in the market.
This secular decline in P/E multiples has happened before. The bear market of the 1970s was characterized by contracting P/E multiples during a period of accelerating inflation and rising interest rates. The experience of the 1970s was, in many ways, the mirror image of our current experience. Low nominal returns were overwhelmed by high levels of inflation, leading to poor real returns. The 7.5% inflation rate of the fourteen years ending 31 December 1981 overwhelmed the single-digit nominal returns of the market. The result was investors who, in real terms, lost money in the equity markets for over a decade.
It is this experience that causes us to counsel caution. We are looking for opportunities to avoid the disappointing experience investors have realized in past periods of excessive valuation. Fortunately, there are currently opportunities in the market that appear much more attractive for investors. In particular, I believe the inexpensive valuation in the mid- and small-cap areas of the market provides meaningfully more opportunity while avoiding the valuation risk in the large capitalization universe.
Valuations in the mid-cap and smaller capitalization area of the market approach normal levels of valuation given the current levels of interest rates. The excitement surrounding the accelerating near-term growth of several mega-cap stocks, such as Tesla and Nvidia, has not affected the valuation of companies down the capitalization spectrum. Because valuations are more reasonable down the capitalization scale, I believe these companies should not experience the multiple contraction of larger capitalization companies.
We are intrigued by the data provided by Leuthold (see Exhibit 4), which represent the current valuation of the smaller capitalization markets and how these markets are priced to provide a more normal, long-term return for investors. We agree with their conclusion. Smaller capitalization asset classes should be able to provide more normal returns because they are currently priced more in line with the current interest rate environment. As a result, I believe they should not experience the multiple contraction that is such a hindrance for the performance of the larger capitalization areas of the market. Therefore, to the extent possible, we would recommend equity investors move down the capitalization scale to capture this relatively attractive opportunity.
Exhibit 4
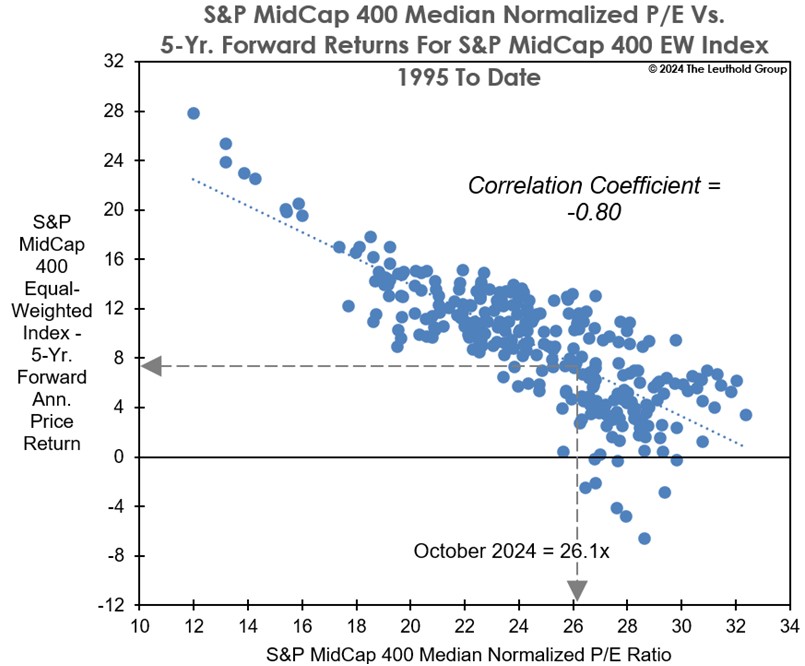
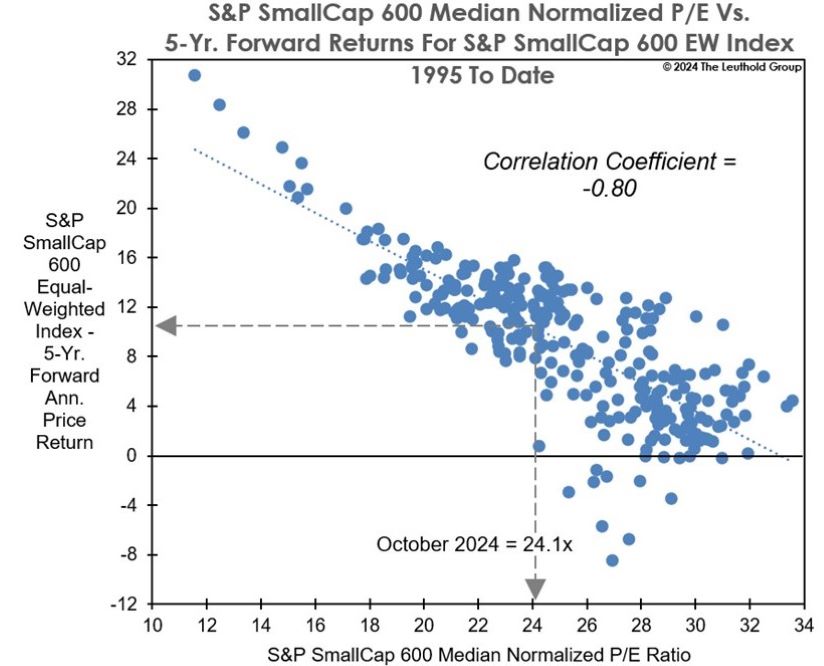
Source: The Leuthold Group. Used with permission.
Investors face a challenging environment with higher likelihood that long-term equity returns fall below historical averages due to the contraction of market valuations from today’s elevated level. However, there are still many opportunities for active managers willing to look beyond some of the largest stocks that have been driving the market. I believe valuations in mid-and small-cap stocks appear more reasonable, positioning these segments for returns more in line with historical returns.
The views expressed are those of the author as of December 2024 and are subject to change without notice. These opinions are not intended to be a forecast of future events, a guarantee of future results or investment advice. Investing involves risk, including the possible loss of principal. Past performance is not a guarantee of future results.
S&P 500 Index measures the performance of 500 large companies in the US. S&P SmallCap 600 Index measures the performance of small-cap companies in the US. S&P MidCap 400 Index measures the performance of medium-sized companies in the US.
Price-to-earnings (P/E) ratio measures a company’s share price relative to its earnings per share (EPS).
Earnings per share (EPS) is the total net income divided by the number of shares outstanding. GAAP EPS is the number derived from generally accepted accounting principles (GAAP) that must be reported by a company as part of its Securities & Exchange Commission (SEC) filings.
/sitefiles/live/documents/insights/Blog/2025/A-747/2501-Chuck-Bath-Long-term-Equity-Returns.pdf